4 min read
Best WordPress Product Visualization Plugins 2026

Adding charts and graphs to your content is one of the most effective ways to communicate data-heavy information. While screenshots from spreadsheets are one option, WordPress has better alternatives. The right visualization plugin lets you enter data directly, connect to a Google Spreadsheet, upload a CSV file, or query an external database. Here are the best WordPress product visualization plugins for 2026.
1. wpDataTables
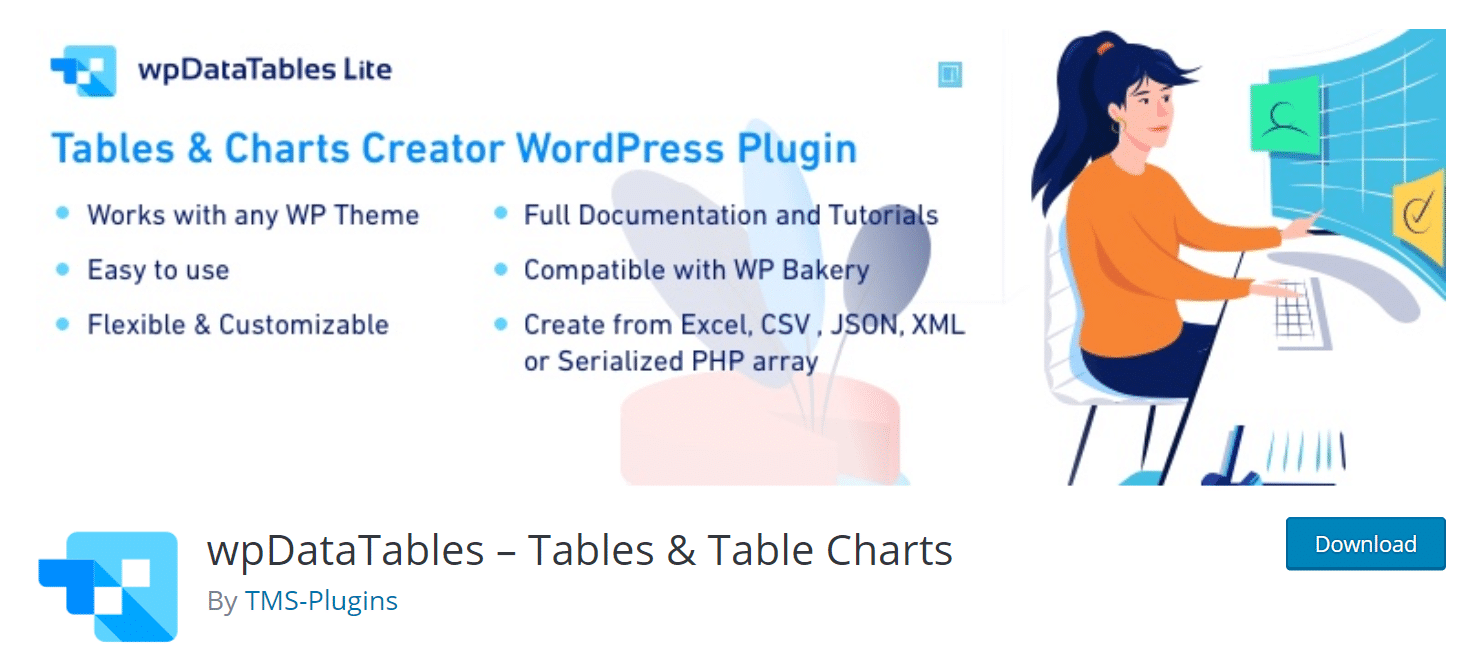
wpDataTables is a freemium WordPress table plugin with a clean interface and a strong feature list. It lets you build interactive tables and attractive charts, with plenty of options for importing external data.
Main Features:
- Edit tables in an Excel-style interface directly in the WordPress dashboard
- Responsive tables with control over which columns collapse on mobile
- Import from Excel, Google Sheets, MySQL, and more
- Convert tables into interactive charts powered by Highcharts or Chart.js
- Per-column table filtering for visitors
- Front-end table editing, including the option to let users edit their own rows
- Excel-style features: formulas, conditional formatting, and more
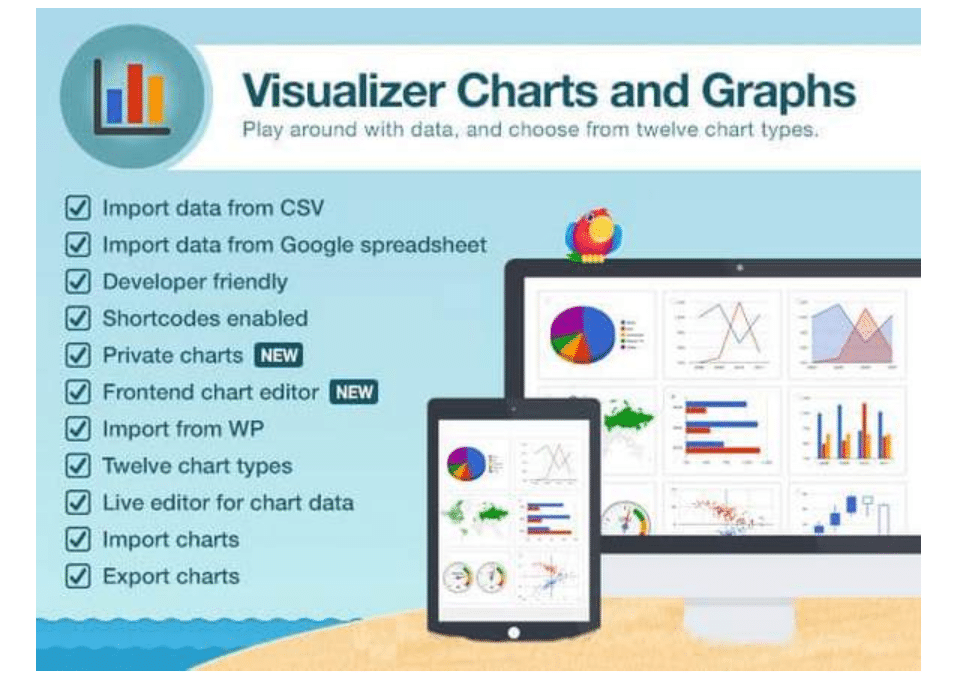
2. Visualizer
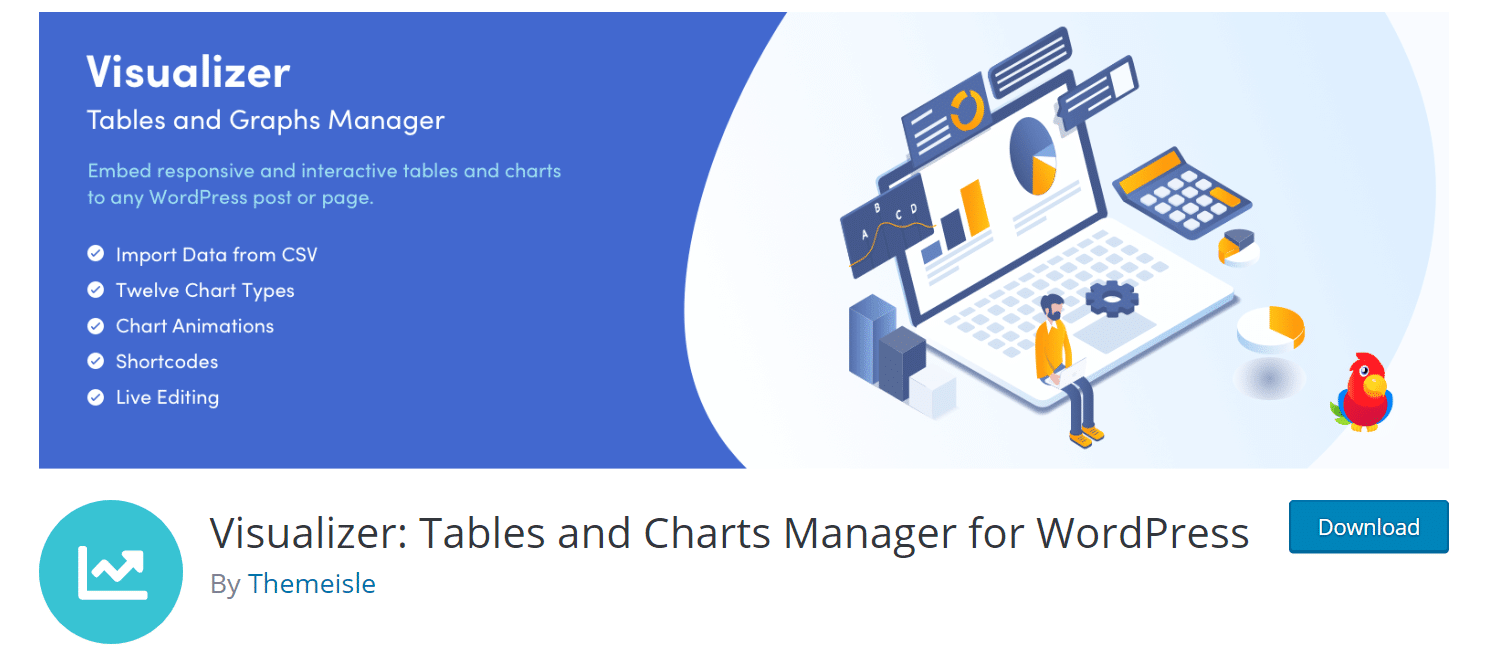
Visualizer is a free plugin for adding charts to your WordPress website. It can use data from files you upload or from a URL (including public Google Spreadsheets). Charts are built with HTML5 for fast loading and mobile responsiveness.
Available chart types: Area, Line, Bar, Pie, Column, Geo, Scatter, Candlestick, Gauge
Once activated, build your first chart from the Visualizer library in the Media sub-menu. Choose a chart type, then upload a CSV file or enter a CSV URL. The chart preview updates in real time. Customize labels, sizes, and chart properties, then add charts to posts and pages using the provided shortcode or via the Add Media button.
3. Live Responsive Chart
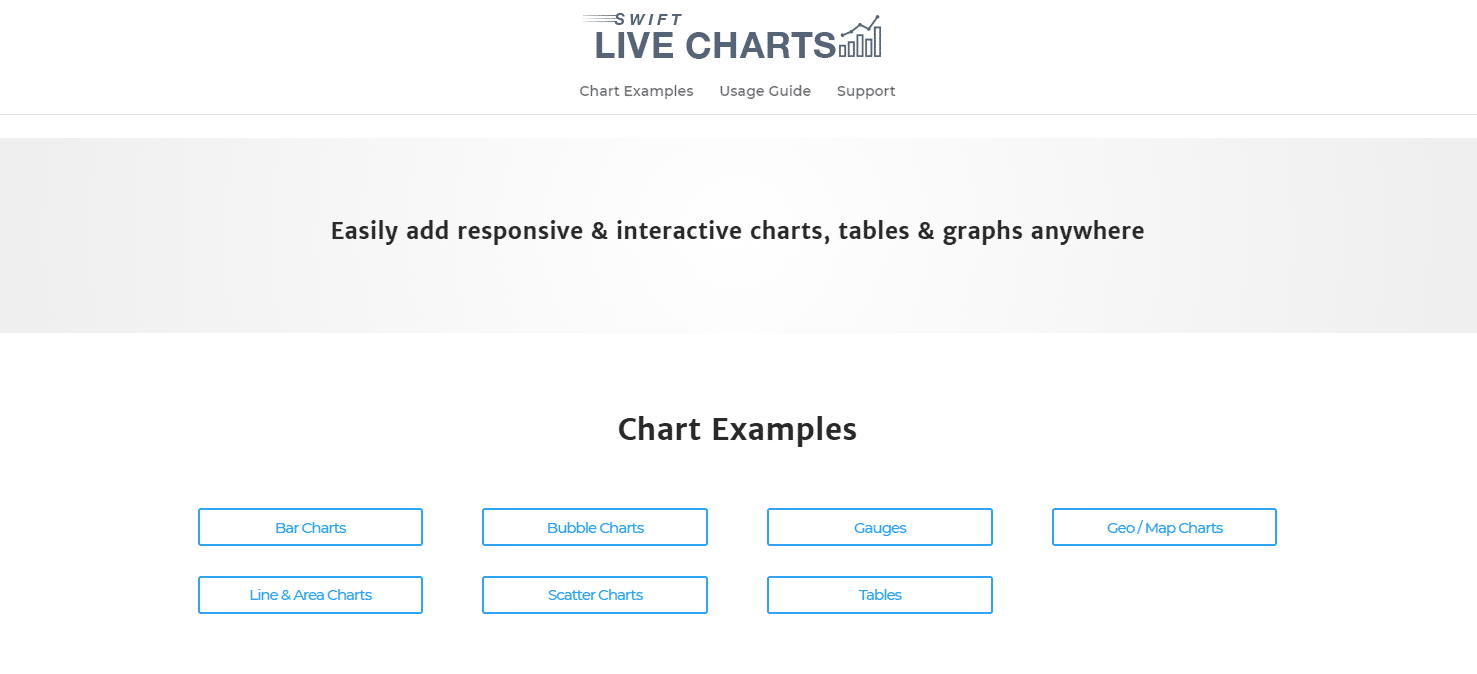
Live Responsive Chart lets you build charts using a live editor, your own CSV files, or synced data from a published Google Sheet. It uses Google’s chart library to handle large datasets without slowdown.
Key features:
- Live preview, select a chart type and instantly see your data redrawn
- Fully responsive, set a chart height and the width fills its container automatically
- 240+ customization options: point types (square, circle, star, triangle, diamond), custom X/Y labels, point size, animations, grid lines, line curves, legend position, and more
- Google Sheets integration, publish your sheet as a CSV and paste the URL
- CSV import support
- Handles thousands of data points efficiently
4. Responsive Charts
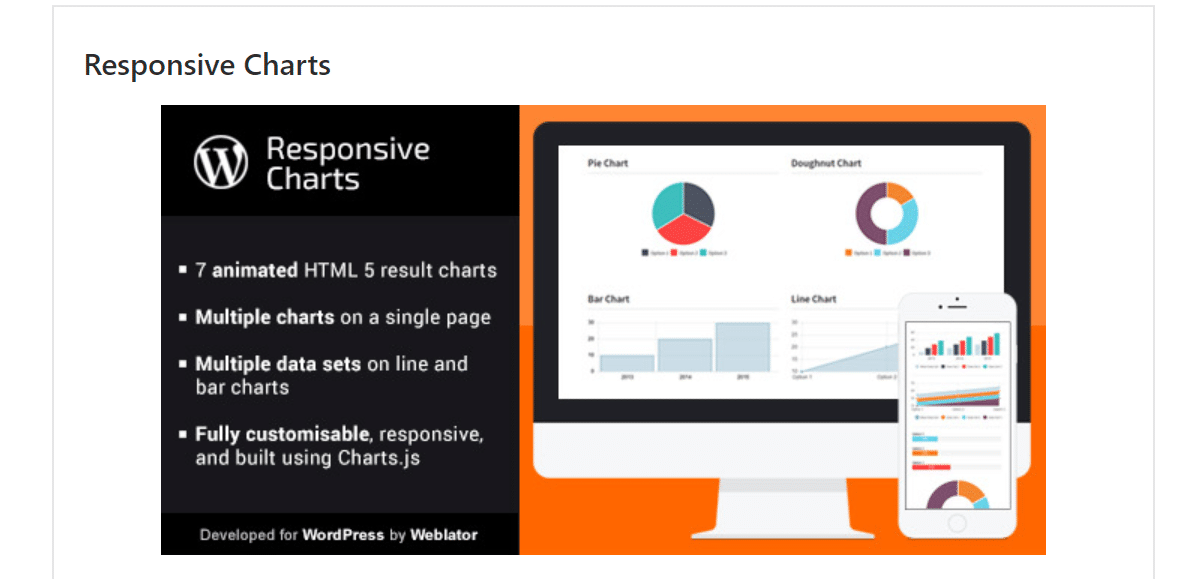
Responsive Charts uses HTML5/SVG technology for cross-browser compatibility (including older IE versions) and mobile support. Visitors need no additional plugins or software, just a web browser. The free version includes 9 chart types: area, line, bar, pie, column, geo, bubble, table, and scatter.
Pro version features:
- Import data from external tables, charts, and graphs
- Excel-style data editor
- 6 additional chart types: Timeline, Gauge, Candlestick, Radar/Spider, Combo, Polar Area
- Regular data synchronization
- External database imports
- Visitor-editable charts
- Private charts with customizable permissions
- Charts from products, pages, or custom post types
5. DW Chart
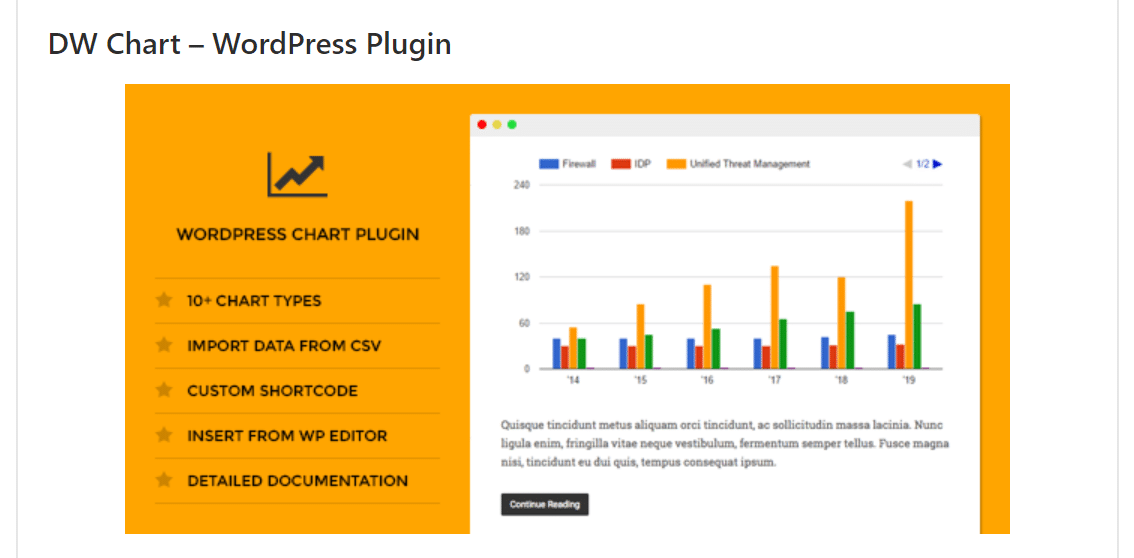
DW Chart is a WordPress plugin for creating Google Charts from imported data. It uses the Google Visualization API and supports 10 fully customizable chart types: Bar, Area, Geo, Column, Line, Combo, Pie, Waterfall, Trendlines, and Scatter. Charts are built by uploading a CSV file, with Google Spreadsheet import support planned in future updates.
6. Visualizer Pro
Visualizer Pro adds 9 types of animated charts to your posts. Import data from Google Docs or a CSV file, then customize each chart using a live editor that shows changes in the browser in real time. Control border, color, size, legend, background, text, and layout options. Each chart gets a unique shortcode for use on any page or post. An archive keeps all your previously created charts so you can reuse or restore them at any time.
7. WP Business Intelligence
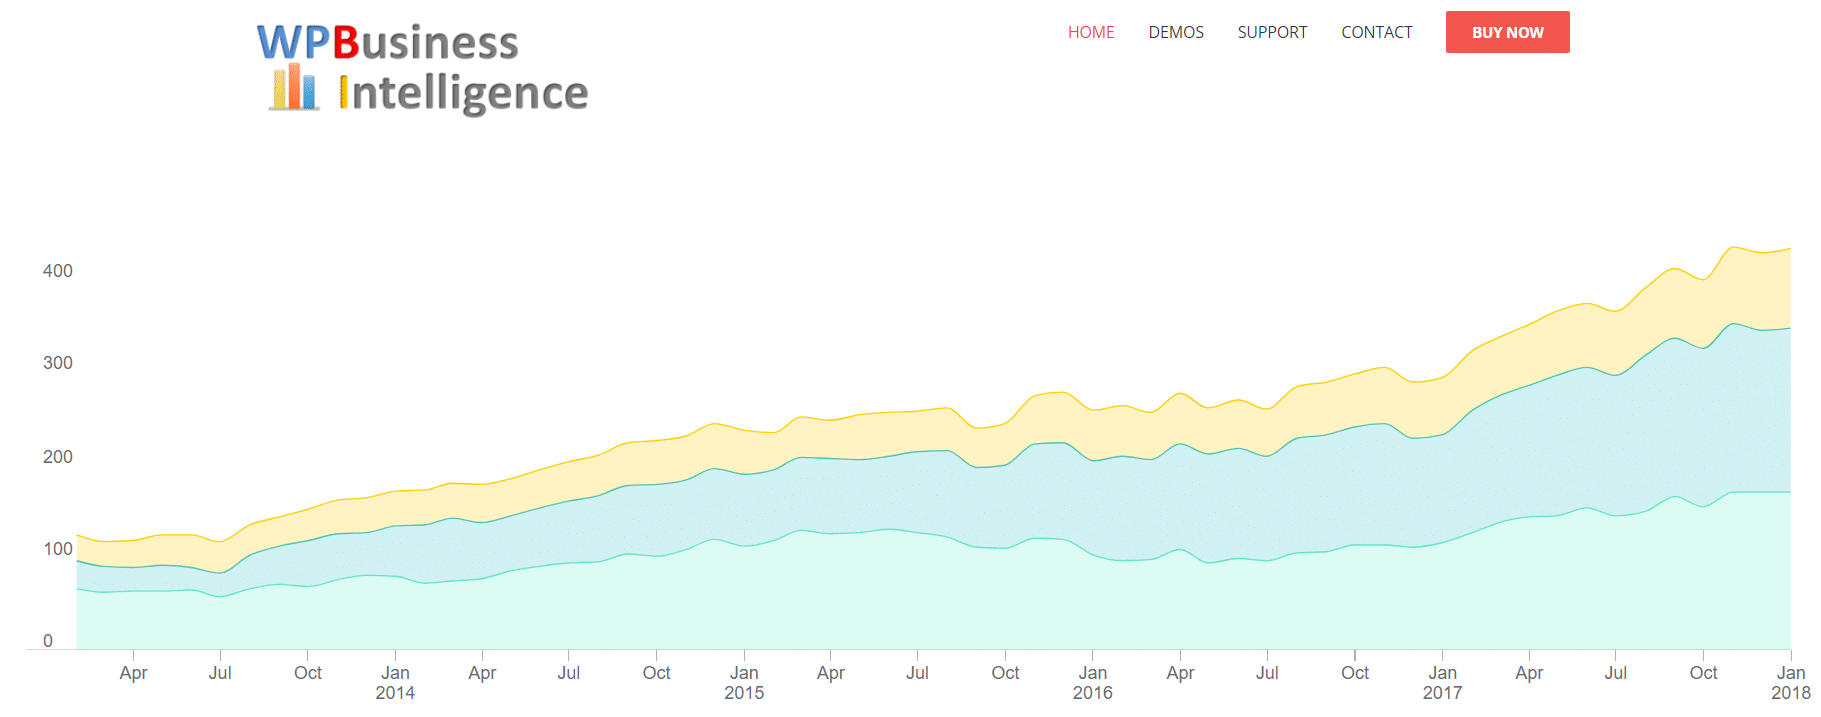
WP Business Intelligence turns your WordPress site into a business intelligence tool. Unlike other chart plugins, it generates charts, graphs, and tables from database queries. The free version lets you query your WordPress database. Premium versions connect to external databases, the Enterprise tier supports unlimited Oracle, MySQL, PostgreSQL, and Microsoft SQL Server connections.
Charts and tables update automatically when a visitor loads the page, always reflecting the latest data. After activation, create a query to retrieve the data you want, preview your table or chart, then add it to any page or post via shortcode. The premium versions add more data source options, chart types, and advanced reporting dashboards. Requires SQL knowledge to use effectively.
8. UberChart
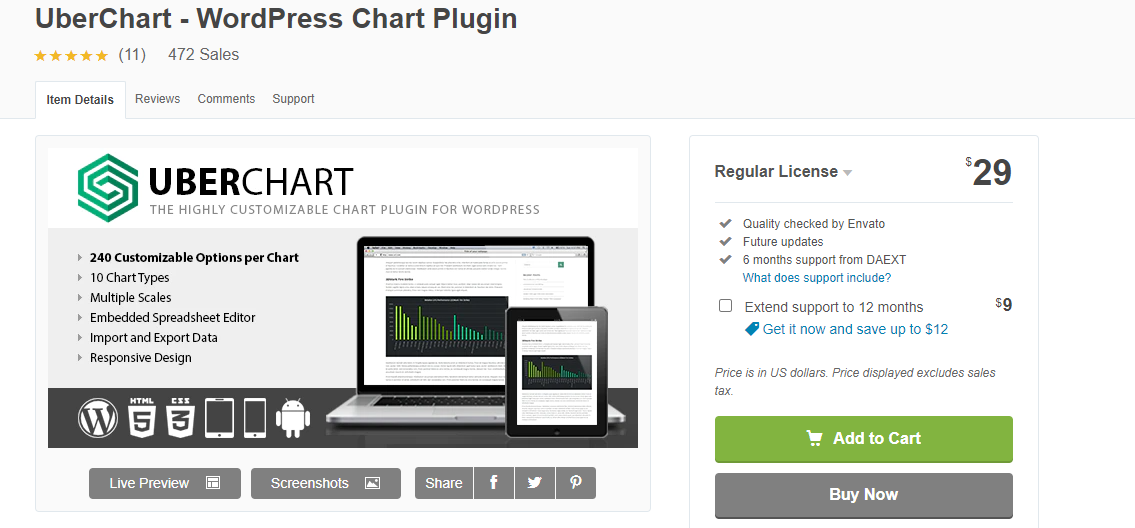
UberChart offers 10 chart types, bar, line, pie, and more, with 240 customization options per chart. Set colors, responsiveness, font styles, and animations. A back-end spreadsheet editor makes data entry simple, and you can upload data directly from Open Office, Excel, or Google Spreadsheets.
Features:
- 10 chart types
- 240 customization options per chart
- Spreadsheet data editor
9. WPBakery Page Builder

WPBakery Page Builder is a fast and easy-to-use page builder plugin with built-in elements for charts, graphs, and galleries. Even without coding experience, you can display complex data visually. Key features include:
- 50+ premium content elements
- Many predefined layouts
- SEO-friendly page composition
- 40+ grid design templates
Final Thoughts
These WordPress product visualization plugins cover a wide range of needs, from simple chart embeds to full business intelligence dashboards. Whether you want to key in data directly, upload a CSV, or connect to a Google Spreadsheet or external database, there is an option here that will work for your site.
Related reading